“We must be willing to let go of the life we planned so as to have the life that is waiting for us.” – Joseph Campbell
This blog post previously appeared in Common Weal’s weekly magazine. Sign up to our Daily Briefing and Weekly Magazine newsletters here.
If you’d like to support my work for Common Weal or support me and this blog directly, see my donation page here.
I would like you to try an experiment with me. Talk about renewables with someone you know who isn’t in the political bubble. It doesn’t really matter if they are for or against renewable energy, but I want you to keep track of how long it takes before they mention a particularly pointed claim against especially wind turbines.
“When it’s too windy, they pay the owners to turn them off!”
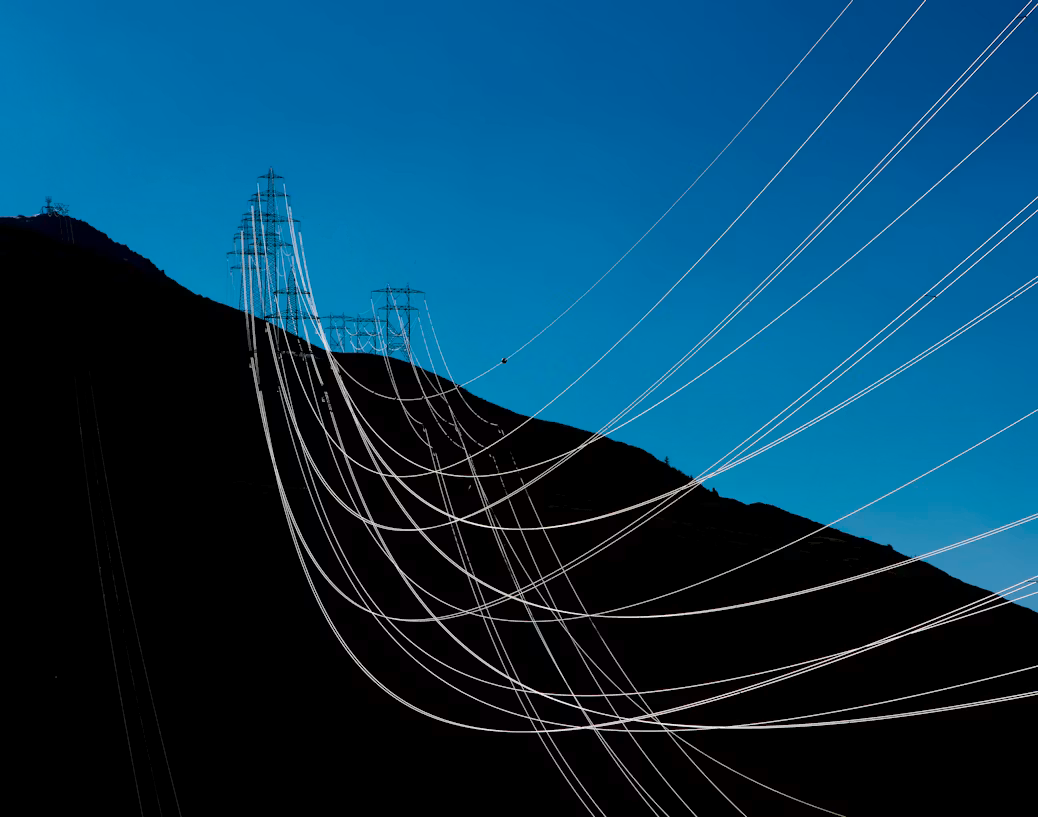
What they’re talking about is called “constraint payments”. And the people saying this have a good point. These payments are a major issue at this stage in the now inevitable transition away from fossil fuels and it’s a consequence of how renewable generators produce energy in a ‘non-dispatchable’ manner.
With many fossil fuel generators, the generators can be turned on or off to suit demand (it’s actually not as simple as that – many generators can’t really be ramped up and down or doing so is neither cheap nor efficient and things like nuclear plants are even more limited in how they can respond to demand) but wind turbines only produce energy when the wind blows. This is a problem if there’s no wind but there’s high demand, but it’s also a problem if there’s high wind but low demand – an overnight storm when everyone is sleeping could well overload the grid.
The problem is further compounded by the fact that the UK has an extremely privatised energy generation sector. If everything was owned by the State under, for example, GB Energy (not my preferred solution, but we’ll get back to that), then turbines could be strategically turned off so that supply matched demand. Under a state monopoly, the revenue from the generation would go down, but as revenue isn’t as important as service (I would hope that a single state energy company would run as a not-for-profit anyway) then it all balances out in the end anyway.
The problem comes when various different private companies own some but not all of the turbines. If the energy regulator issues an instruction to a private company to stop generating, then they lose revenue but their competitor who has been chosen today to keep their turbines turning might not.
The solution, to stop the private companies complaining, is constraint payments. Simply paying the generators to shut up and turn their turbines off for the greater good. It’s hardly an optimal solution and it rightly earns the ire of people who live near the turbines but are still paying through their teeth for energy because of all of the other problems we have in the system.
A possible solution came to me this week while reviewing some of the work coming out of our Energy Working Group. The UK is pumping out an overwhelming number of public consultations on energy transformation just now. Common Weal doesn’t usually respond to UK consultations but energy is such an important issue that we feel that we must. However, some of them are ‘public’ in name only as they are long, technical and extremely pedantic in a way that means that only those with specific expertise in the energy sector have a hope of responding to them meaningfully. They certainly don’t adhere to the UK’s own principles of good public consultation.
But our unsung heroes in the Energy Group are doing an amazing job – especially Gordon Morgan who has been taking the lead on many of the responses. I hope to share the latest of them with you all soon.
It was in one of his most recent responses that he mentions something that caught my eye. Common Weal is still arguing for the UK energy sector to be rearranged along the lines of Zonal Pricing. Rather than the current system that prices electricity essentially based on the distance between the generator and London and then from London to you house (there were good reasons for this in the age of coal, not so much now), Great Britain would be split into multiple zones and if your zone happened to be a net exporter of energy, then you could get a discount on your bills – as Scotland is a massive resource for renewables, this would almost certainly mean Scotland would get deeper discounts than, say, London.
There are complications with this plan that Sweden – which has implemented a form of zonal pricing – has to contend with. What happens if the energy exporting zone hits the limits of what it can export? If an Island is generating more energy than it can physically export to the mainland, or if the interconnectors between Scotland and England are maxxed out? If the bottleneck in the system isn’t the generators or the users, but the infrastructure in between?
In Sweden’s case, they have their own form of constraint payment – a congestion revenue – that kicks in and starts arising when generators need to move energy out of their zone. The system isn’t quite the same as the constraint payments issue but here is the key difference between here and there.
In Britain, the constraint payments can be stuffed into the pockets of the owner of the generator. In Sweden, the congestion revenue payments must either be returned to consumers as a discount or must be invested into means of reducing the need for future constraint payments. The payments pay to try to remove the need for themselves.
“If Sweden can do it, why can’t the UK?”
What this means in practice is that there are more investments into interconnectors between the Zones. It could also mean more investment into things like energy storage so that instead of shutting down capacity when limits are reached, then the batteries can be charged instead and then used when demand within the Zone exceeds supply.
Like Sweden does, I could even see a case for discounts or negative pricing for consumers to try to encourage more energy use within the Zone during these times (though in line with Circular Economy principles, we don’t want to encourage too much outright wasteful usage).
So my proposal is this: If Sweden can do it, why can’t the UK (or Scotland, if we ever become independent or energy gets more substantially devolved)?
We don’t have the inter-Zone issue because we don’t (yet) have Zonal Pricing, but the same principle could apply to constraint payments more generally. Companies could continue to collect payments in exchange for turning their turbines off during high winds, but they must not book the money as a profit for themselves. Instead, the payments must be invested into reducing the need for future constraints. They could invest the money into interconnectors (or into driving up more demand within high resource Zones to minimise the need for more interconnector cables), or into energy storage, or pass it down as a discount to customers. But they can’t just keep the cash.
As I say, none of this is my preferred solution. The private sector led, market model of energy doesn’t work (a view recently presented by a coalition of African trade unions, showing that commentators in the UK really need to start looking beyond our borders for better ideas) and we really should be bringing our energy sector back into public ownership. But until that happens, we could be regulating and running the private sector a lot more tightly than we currently do. This one idea – using constraint payments to drive the transition rather than pad the pockets of shareholders – could be a useful step in that direction.


